Real depth, not just a demo toggle
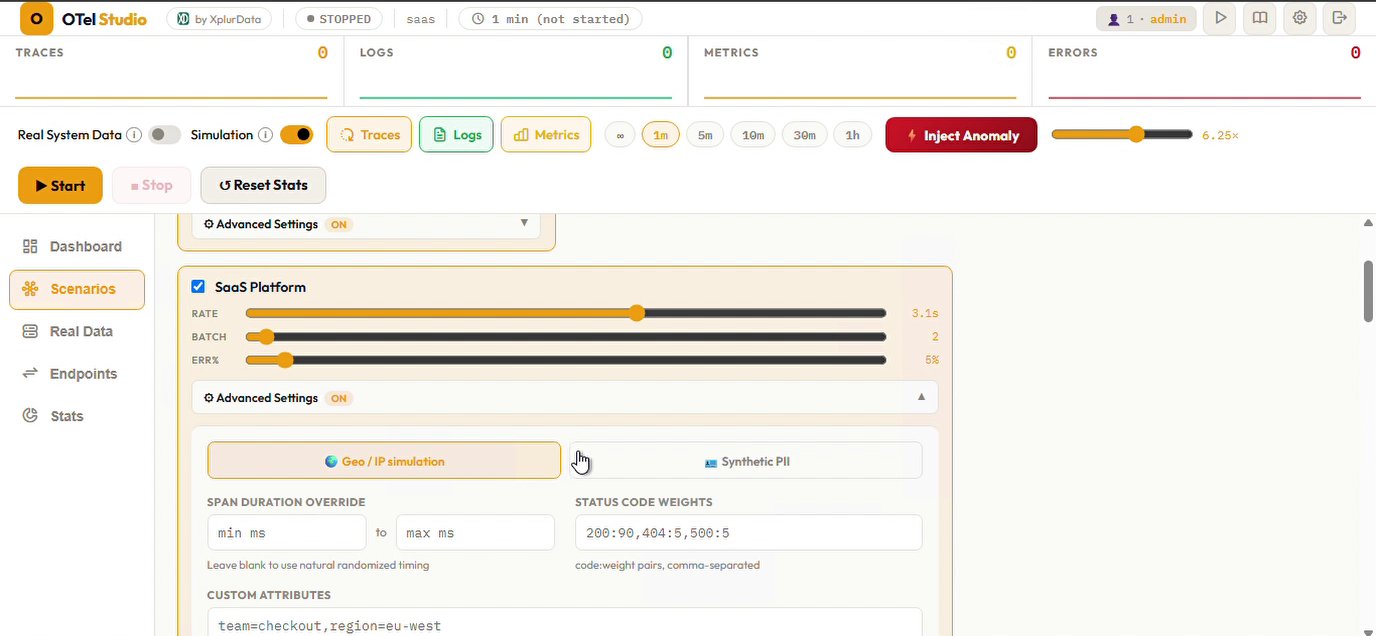
Every scenario has an Advanced panel — geo/IP simulation, synthetic PII, custom attributes, span duration overrides, weighted status codes.
A telemetry data generator, by XplurData
OTel Studio generates that traffic for you — realistic, correlated traces, logs, and metrics across 25 service topologies, sent to any OTel-compatible backend in 60 seconds. No code, no app to deploy.
Quick Start
docker run -d --name otel-studio -p 3002:3002 \
  -e OTEL_ENDPOINT="http://your-collector:4317" \
  -e OTEL_PROTOCOL="grpc" \
  -e SERVICE_NAME="otel-agent" \
  -e ENVIRONMENT="production" \
  -e ADMIN_PASS="your-password" \
  -e MODE_REAL="true" \
  -e MODE_SIM="true" \
  -v /var/log:/var/log:ro \
  -v /var/run/docker.sock:/var/run/docker.sock \
  -v otel-data:/data \
  ghcr.io/xplurdata/otel-studio:latest
If your collector runs in Docker too, add --network <your-network> so the hostname in OTEL_ENDPOINT resolves — see Docker Configuration for details.
Four steps from zero to realistic, correlated telemetry.
Choose from 25 realistic service topologies — or run several at once.
Traces, logs, and metrics with matching trace IDs, real parent-child span chains.
gRPC or HTTP, to one endpoint or several simultaneously.
Grafana, Datadog, SigNoz, Honeycomb, or any OTel-compatible tool — no code required.
Most observability teams can't test their pipelines realistically because they don't have good data generators.
| Tool | Limitation |
|---|---|
telemetrygen | CLI-only, random data, no service topology, no UI |
| hotrod / astronomy-shop | Full demo apps — heavy to deploy, not configurable |
| k6 / Gatling | Load-testing tools, not observability-focused — no trace/log/metric correlation |
| Hand-written scripts | Every team reinvents the same wheel |
Not random noise — actual request chains with parent-child spans, correlated logs, matching metrics.
Web App, Infrastructure, APM, Cloud Native, and Chaos/Stress topologies — real parent-child request chains, not random data.
Logs share trace IDs with the spans that produced them. Search a trace ID, see the matching logs and metrics.
Dedicated error-storm, cardinality-burst, and latency-spike modes for testing alerting and dashboards.
Send to two or more OTel backends simultaneously, with independent TLS/mTLS per endpoint.
Tag generated telemetry with realistic regional IP ranges, or safe RFC 5737 test ranges.
Opt-in, per-scenario synthetic user data for testing redaction and DLP pipelines — never real people's data.
Optionally tail real log files and Docker container logs/metrics alongside simulated traffic.
Grafana Alloy, OTel Collector, Elastic APM, Honeycomb, Jaeger, SigNoz, OpenObserve, Datadog, New Relic, Dynatrace, Lightstep.
Every scenario has an Advanced panel — geo/IP simulation, synthetic PII, custom attributes, span duration overrides, weighted status codes.
Setting up a new o11y stack who need realistic data before they have real production traffic.
Demoing a new backend to stakeholders without waiting on a live integration.
Writing alert rules or dashboards who need controllable error/latency scenarios to test against.
Tools like SigNoz, OpenObserve, and Coroot needing a test data generator for their own CI/testing.
No. OTel Studio generates telemetry independently — it doesn't instrument or touch your actual application at all. It sends realistic OTLP traces, logs, and metrics directly to your collector or backend, so you can validate dashboards, alerts, and pipeline configuration without deploying anything to your real services.
No, and it isn't meant to. Real traffic will always surface things synthetic data can't. What OTel Studio is for is everything before that — validating that your collector config, dashboards, and alert rules actually work at all, before you have real traffic to test against, or when you need controllable, repeatable error/latency conditions that real traffic won't reliably give you on demand.
Yes — OTel Studio speaks standard OTLP (gRPC or HTTP) to any compatible endpoint, self-hosted or cloud. The one-click stack presets cover 12 popular backends, but any OTLP receiver works, including a self-hosted OpenTelemetry Collector, Grafana stack, Jaeger, or your own custom pipeline.
Those tools are great for sending a single, precise OTLP payload to test one specific rule. OTel Studio is built for the opposite case — realistic, correlated traffic across many simulated services at once, with logs that share trace IDs with the spans that produced them, controllable error rates and latency spikes, and a UI so you can adjust scenarios live instead of editing a script and re-running it.
Each of the 25 scenarios models a genuine service topology — real parent-child span chains, realistic log messages per service (JVM GC pauses, Kubernetes OOMKills, gRPC deadline errors, and similar), and natural signal ratios where logs outnumber traces the way they do in real systems. It's synthetic, but built to resemble what an actual distributed system produces, not randomized filler.
Yes — multi-endpoint fanout is built in, with independent TLS/mTLS configuration per endpoint. Useful for comparing two backends side by side, or validating a migration before cutting traffic over entirely.
See the LICENSE file in the repository for the current terms.
Docker-deployable in under a minute. No account, no cloud dependency.
Read the Quick Start →